- 您现在的位置:买卖IC网 > Sheet目录501 > QEB373YR (Fairchild Optoelectronics Group)LED IR EMITTING 940NM 2MM YK T/R
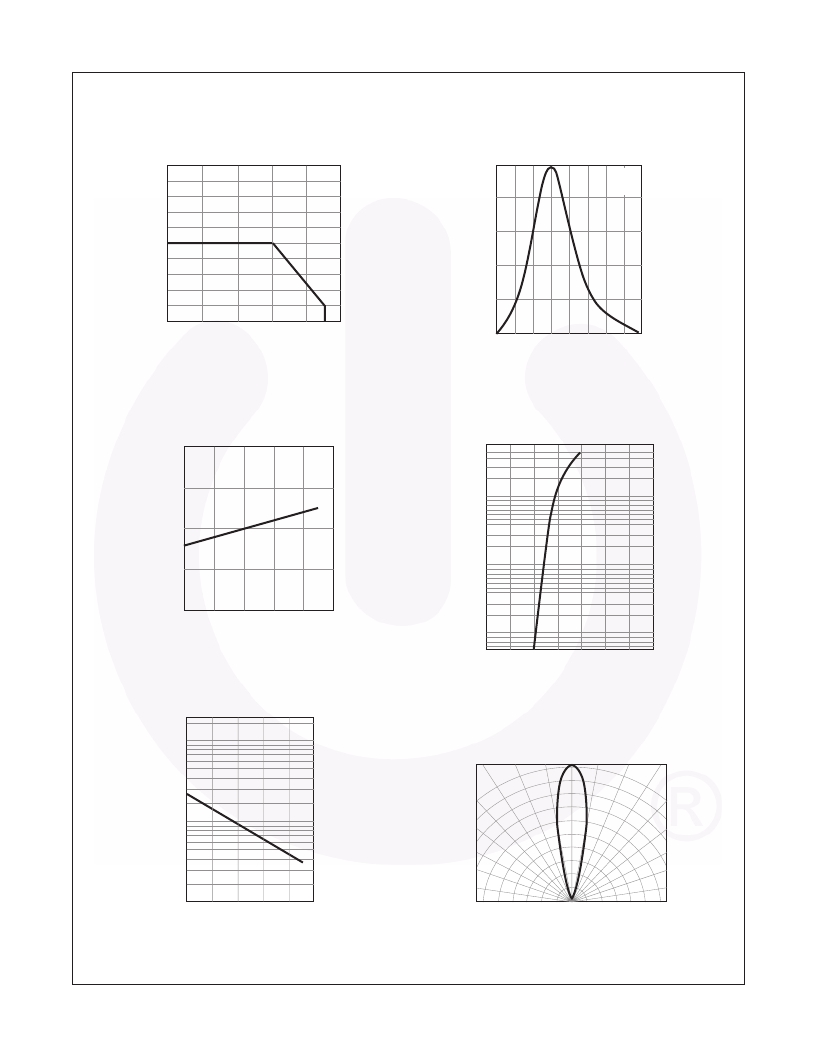
Typical Performance Curves
Fig. 1 Maximum Forward Current vs.
Temperature
200
160
120
80
Fig. 2 Relative Radiant Intensity vs.
Wavelength
100
I F = 20 mA
T A = 25?C
80
60
40
40
20
0
-25
0
25
50
75
85
100
0
810 835 855 875 905 925 945 965 985
Ambient Temperature T A (?C)
Fig. 3 Peak Emission Wavelength vs.
Ambient Temperature
920
900
500
200
100
Wavelength λ (nm)
Fig. 4 Forward Current vs.
Forward Voltage
50
875
20
860
10
5
840
-25
0
25
50
75
100
2
1
Ambient Temperature T A (?C)
1
0.5
1.0
1.5
2.0
2.5
3.0
3.5
Fig. 5 Relative Radiant Flux vs.
Ambient Temperature
20
10
Forward Voltage V F (V)
Fig. 6 Relative Radiant Intensity vs.
Angular Displacement
30
20
10
0
10
20
30
5
2
1
0.5
0.2
0.1
40
50
60
70
80
90
40
50
60
70
80
90
-25
0
25
50
75
100
0.6
0.4
0.2
0
0.2
0.4
0.6
Ambient Temperature T A (?C)
?2009 Fairchild Semiconductor Corporation
QEB373 Rev. 1.0.1
3
Ambient Temperature T A (?C)
www.fairchildsemi.com
发布紧急采购,3分钟左右您将得到回复。
相关PDF资料
QEB421TR
LED IR EMITTING 880NM 2-PLCC T/R
QEC113C6R0
LED IR GAAS 940NM PEACH 3MM
QEC121
LED IR EMITTING ALGAAS 880NM 3MM
QEC122C6R0
LED IR ALGAAS 880NM PURPLE 3MM
QED221
LED IR EMITTING ALGAAS 880NM 5MM
QED234A4R0
LED IR EMITTING ALGAAS 940NM 5MM
QEE113
LED IR EMITTING 940NM SIDELOOKER
QEE123E3R0
LED IR ALGAAS SIDELOOK 880NM
相关代理商/技术参数
QEB373ZR
功能描述:红外发射源 Subminiature LED Plastic RoHS:否 制造商:Fairchild Semiconductor 波长:880 nm 射束角:+/- 25 辐射强度: 最大工作温度:+ 100 C 最小工作温度:- 40 C 封装 / 箱体:Side Looker 封装:Bulk
QEB421
功能描述:红外发射源 PLCC-2 ALGAAS LED RoHS:否 制造商:Fairchild Semiconductor 波长:880 nm 射束角:+/- 25 辐射强度: 最大工作温度:+ 100 C 最小工作温度:- 40 C 封装 / 箱体:Side Looker 封装:Bulk
QEB421_Q
功能描述:红外发射源 PLCC-2 ALGAAS LED RoHS:否 制造商:Fairchild Semiconductor 波长:880 nm 射束角:+/- 25 辐射强度: 最大工作温度:+ 100 C 最小工作温度:- 40 C 封装 / 箱体:Side Looker 封装:Bulk
QEB421TF
制造商:Fairchild Semiconductor Corporation 功能描述:
QEB421TR
功能描述:红外发射源 infrared LED SMD RoHS:否 制造商:Fairchild Semiconductor 波长:880 nm 射束角:+/- 25 辐射强度: 最大工作温度:+ 100 C 最小工作温度:- 40 C 封装 / 箱体:Side Looker 封装:Bulk
QEB441
功能描述:LED INFA RED PLCC-2 PKG SMD RoHS:是 类别:光电元件 >> 红外发射极 系列:- 标准包装:1,200 系列:- 电流 - DC 正向(If):100mA 辐射强度(le)最小值@正向电流:27mW/sr @ 100mA 波长:940nm 正向电压:1.6V 视角:40° 方向:顶视图 安装类型:通孔 封装/外壳:径向 包装:带卷 (TR)
QEB441TR
功能描述:红外发射源 infrared LED SMD RoHS:否 制造商:Fairchild Semiconductor 波长:880 nm 射束角:+/- 25 辐射强度: 最大工作温度:+ 100 C 最小工作温度:- 40 C 封装 / 箱体:Side Looker 封装:Bulk
QEB50
制造商:P-DUKE 制造商全称:Power Mate Technology Co., LTD 功能描述:50 WATTS DC-DC CONVERTER
